
AstoShop Dashboard
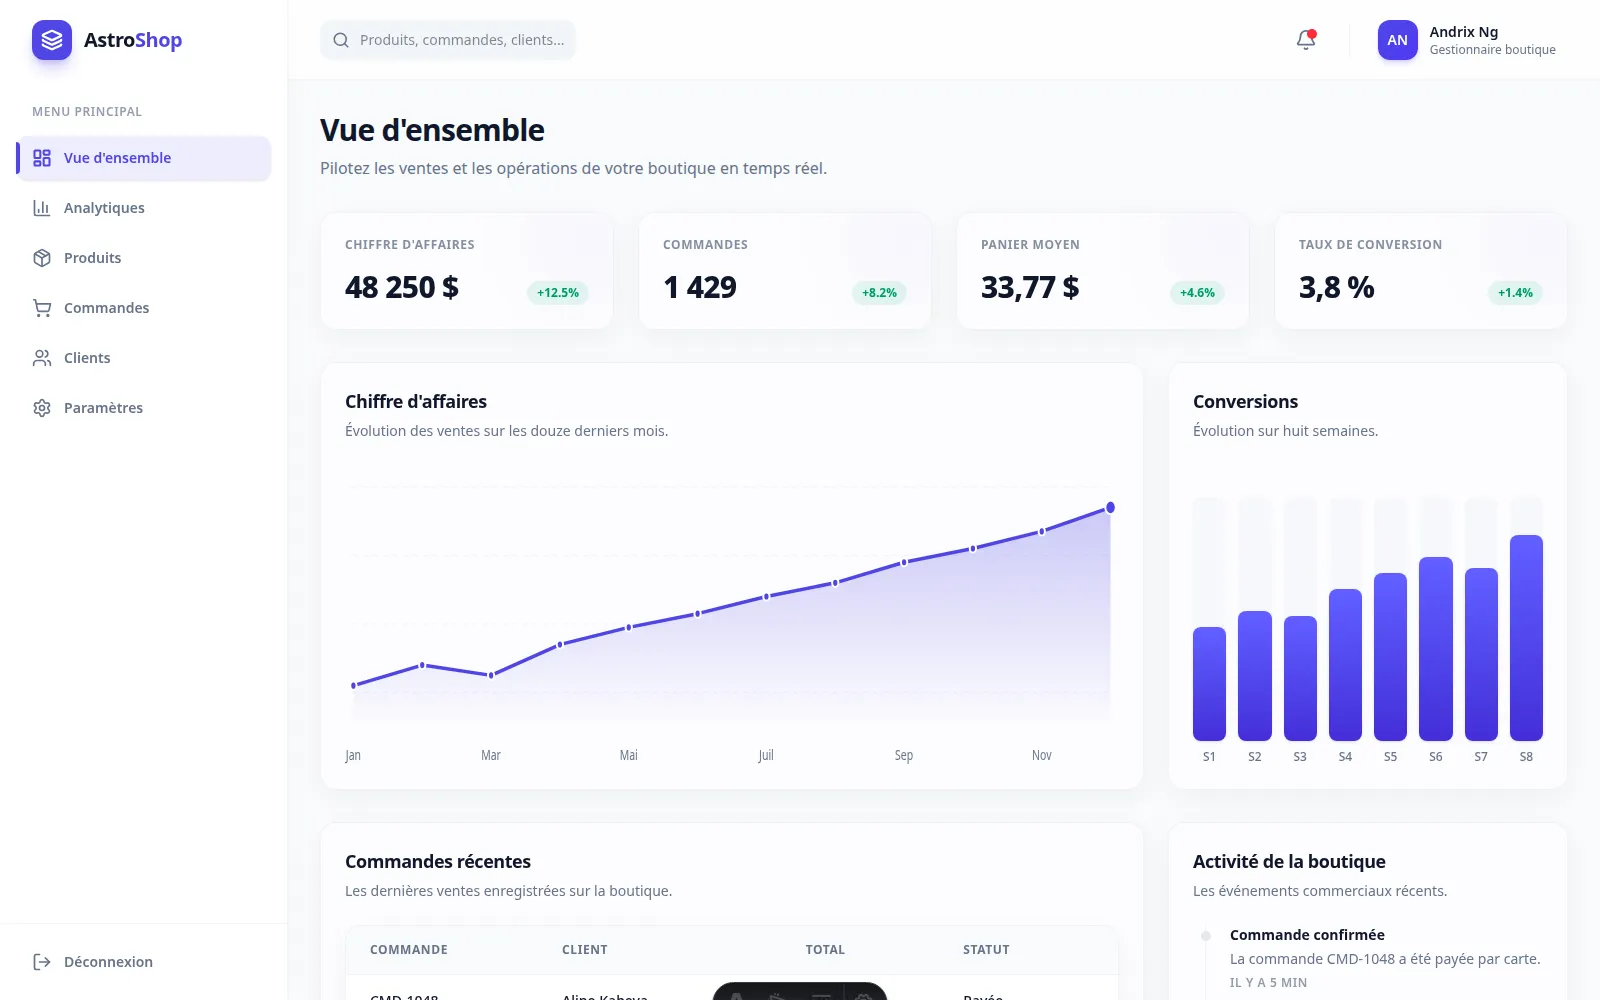
A fast, responsive e-commerce back office for monitoring revenue, orders, products, inventory, customers, acquisition channels, and conversion performance.
Front-End Developer & UI Designer
Project context
A data-rich back office for online store managers to monitor sales, inventory, and daily operations at a glance.
The problem
Online store managers need a clear view of sales and daily operations without navigating a slow or overly complex back office. The interface had to present data-heavy workflows while remaining responsive, accessible, and fast on every screen size.
Technical approach
Designed and built a static-first Astro dashboard with typed commerce data, reusable UI components, responsive business tables, and focused analytics. Revenue and conversion charts use lightweight SVG and CSS, while the interactive acquisition chart is lazy-loaded with Apache ECharts to keep the initial page load small.
Design goal
Bring store activity into a readable interface where summary information leads naturally to detailed tables. Revenue, inventory, orders, and customers have different information densities, but share spacing, typography, and navigation conventions.
Architecture and rendering
The dashboard uses Astro, typed commerce data, and reusable interface components to organize a static-first back office. Tables and summary panels share a consistent structure across products, orders, and customers. This gives the interface a coherent base without requiring every element to become an interactive client-side application.
Typed commerce model
Typed commerce data gives reusable components an explicit input structure. Products, orders, and customers can be presented through consistent table and panel patterns. The documented data supports the interface demonstration; it should not be read as a live operational connection.
Static-first rendering
Astro prepares the main dashboard presentation ahead of time. Interactive chart behavior is introduced where needed rather than making every display element depend on a browser-side framework. This supports a clear separation between information rendering and focused interactions.
Analytics and daily workflows
The overview brings revenue, conversion, and acquisition information together with inventory and order activity. Revenue and conversion charts use SVG and CSS. Apache ECharts is loaded lazily for the interactive acquisition chart, concentrating the heavier charting dependency where it adds value to the interface.
Chart technology choices
Revenue and conversion visuals use SVG and CSS, while the acquisition chart uses Apache ECharts. Lazy loading concentrates the charting library on the interactive view. The choice matches rendering complexity to the behavior expected from each chart.
Tables and responsive layouts
Business tables organize detailed information around the workflows of products, fulfillment, payments, and customers. Responsive presentation needs to preserve the meaning of each row and its labels as space becomes limited. Summary panels provide a shorter reading path before the detailed data.
Key capabilities
- Revenue, conversion, and acquisition analytics
- Product catalog and inventory monitoring
- Order, payment, and fulfillment tracking
- Customer activity and store notifications
Outcome
Improved operational clarity with responsive analytics and lightweight chart rendering.
Project scope
The documented implementation is a front-end dashboard with typed commerce data. It demonstrates presentation and navigation workflows; it does not establish a connection to a live store, payment processor, or inventory service. A production integration would need authenticated data access and reliable synchronization with those systems.
Integration boundary
The front-end model can serve as a base for a connected dashboard, but operational data introduces additional responsibilities. Authentication, permissions, stale data, and failed requests would need explicit handling when replacing the current typed data with remote services.