
Storeflow Dashboard
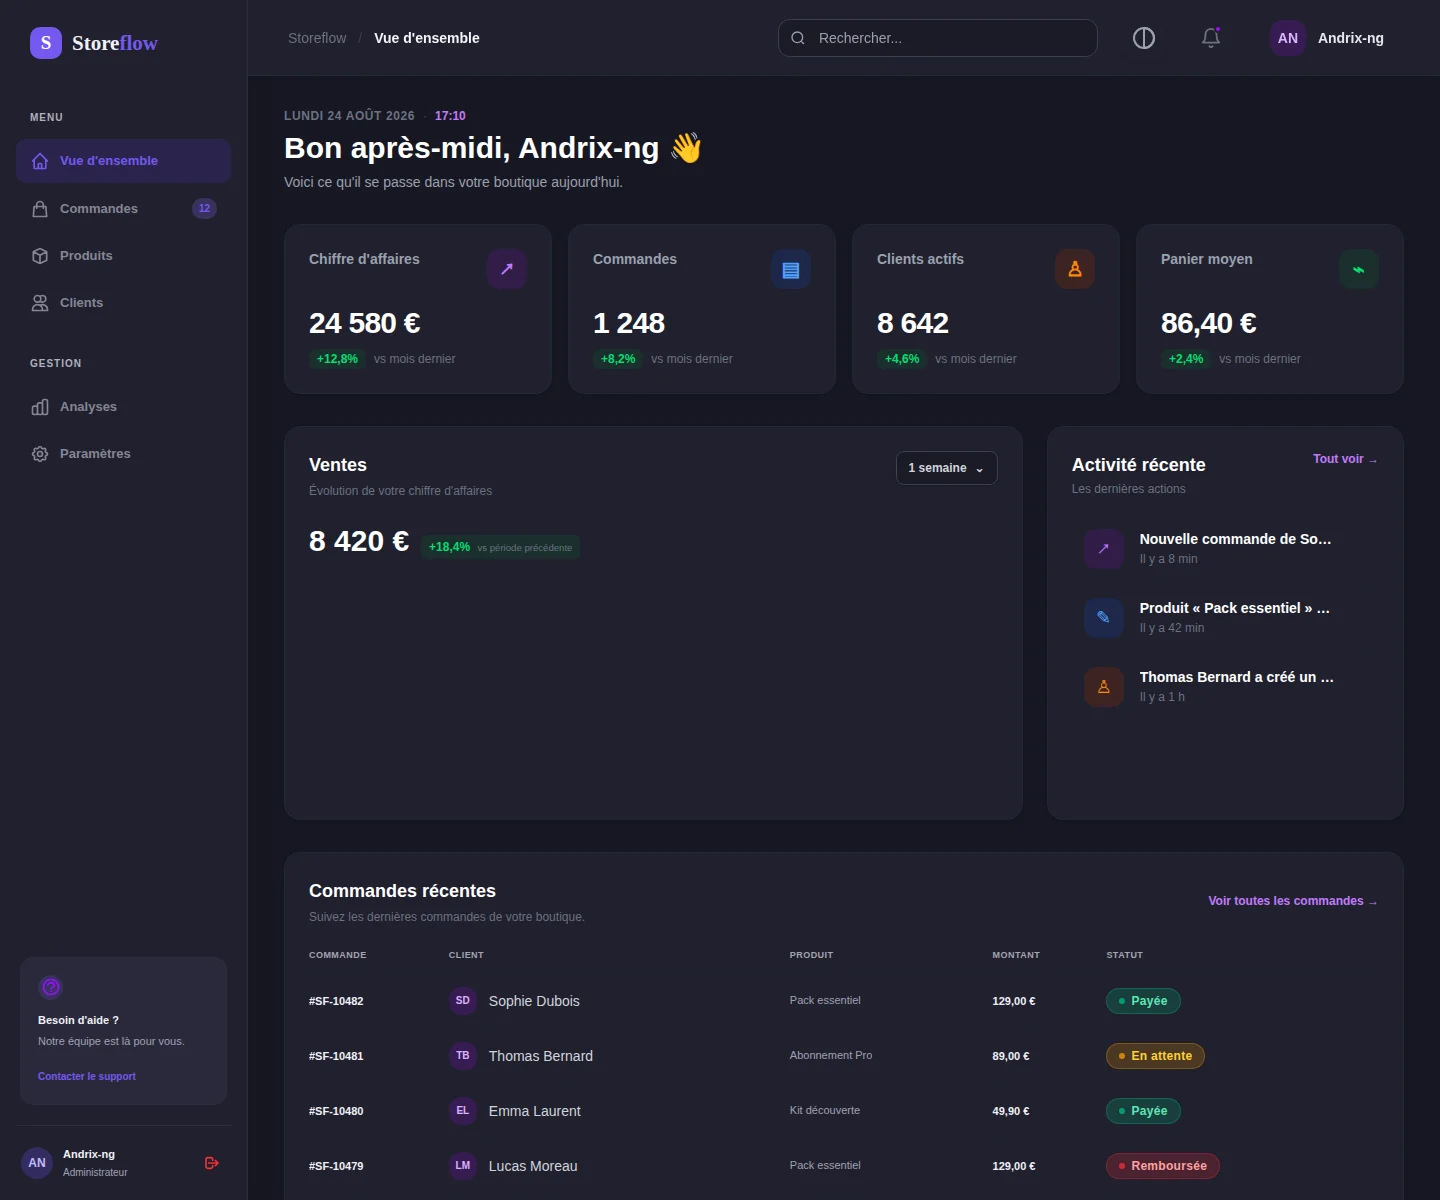
A modern Nuxt 4 e-commerce dashboard for monitoring revenue, orders, products, inventory, customers, analytics, and settings through a responsive interface.
Front-End Developer & UI Designer
Project context
A polished commerce workspace that brings store performance and daily operations into one clear, responsive dashboard.
The problem
Create a professional e-commerce back office that can present dense business data without sacrificing clarity, responsiveness, or maintainability.
Technical approach
Built a Nuxt 4 application with typed domain models, reusable catalog and pagination components, animated Chart.js visualizations, and a cohesive theme system shared across the dashboard.
Design goal
Create a consistent workspace for reviewing sales and navigating everyday commerce information. The overview summarizes activity, while product, order, and customer screens provide detail. Repeated interface patterns reduce the need to relearn controls between screens.
Application architecture
Nuxt 4 and Vue 3 organize the dashboard around typed domain models and reusable components. Catalogues and pagination share common patterns across the commerce screens. The theme system is shared throughout the application so that light and dark appearances follow the same interface structure.
Typed domain models
TypeScript domain models describe the data consumed by Vue components. Separating the model from the presentation makes common catalogue and table patterns easier to reuse. The same approach provides a boundary to review if the demonstration data is later replaced with a remote API.
Reusable component structure
Nuxt 4 supplies the application structure and Vue 3 the component model. Shared catalogue and pagination components carry common behavior across the interface, while individual screens retain their commerce-specific content. Tailwind CSS supports the presentation conventions.
Commerce workflows and analytics
The overview connects revenue and analytics with product, order, and customer views. Chart.js renders animated charts, while paginated tables organize larger collections into manageable pages. Reusable interface patterns help users move between these workflows without having to learn a different layout for each screen.
Chart rendering
Chart.js presents revenue and analytics through animated charts. The chart is a presentation of the supplied data, so its labels and time ranges need to remain consistent with the figures shown elsewhere in the overview. Animation supports the visual transition between values.
Key capabilities
- Responsive e-commerce overview dashboard
- Animated revenue and analytics charts
- Product, order, and customer management
- Reusable UI components with light and dark themes
- Paginated data tables for large collections
Outcome
Made key commerce workflows easier to scan with reusable components, animated analytics, pagination, and light/dark themes.
Scope and integration
The project demonstrates a commerce management interface and its reusable front-end patterns. The available documentation does not establish live payment processing or synchronization with a store backend. Connecting real operations would require authenticated services, permission handling, and clear loading and error states around remote data.
Connecting operational services
A live commerce integration would add authorization, remote pagination, loading states, and error handling to the current interface. Payments and inventory synchronization would require their own service contracts. Those capabilities should be documented only once an implementation exists.